Quarterly Global Warming Report
May 13, 2026
Author
Patrick Wiese, ASA
Executive Summary
This report presents a statistical analysis of global warming trends and is updated quarterly to reflect the latest available air and sea surface temperature data. The previous edition analyzed data from January 1960 through December 2025; this update extends the analysis through March 2026. All results are based on the ERA5 reanalysis dataset produced by the European Centre for Medium-Range Weather Forecasts (ECMWF).
This report is divided into two parts: (1) an analysis of the most recent five years of data, with a focus on the latest quarter (January–March 2026), and (2) estimates of long-term warming trends based on data from 1960 through 2025. Because these long-term trends change little from one quarter to the next, they are updated annually rather than quarterly. The next update will occur in January 2027 and will reflect data through December 2026.
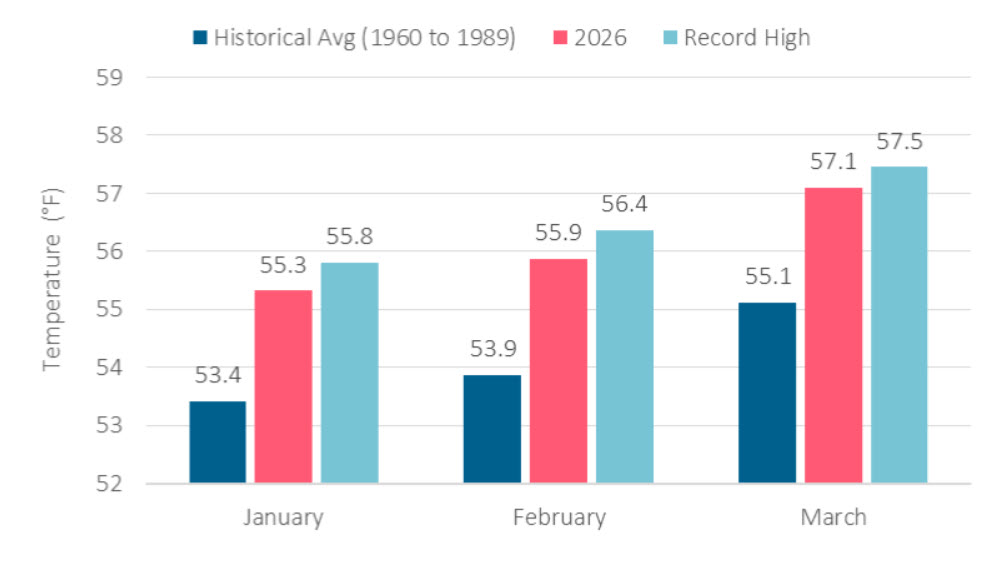
After reaching record-high levels from July 2023 through January 2025, the global-average air temperature has eased slightly from those peaks. In the most recent quarter, temperatures were roughly 2.0°F above their 1960–1989 baseline averages, but about 0.5°F below their record highs (see Figure 1).
Figure 1
Global-Average Air Temperature (°F), Jan to Mar 2026, with Comparison to 1960–1989 Baseline and Historical Records
While quarterly data provides a useful snapshot of recent conditions, a broader perspective is needed to assess underlying climate trends. To this end, this report also examines long-run temperature changes. A key metric in this analysis is the estimated temperature trend, expressed in degrees Fahrenheit per decade and calculated using linear regression over rolling 30-year periods. Thirty years is widely regarded as sufficient to smooth the effects of short-term climate variability—such as El Niño and La Niña events—that can temporarily influence global temperatures. Figure 2 summarizes estimated trends across successive 30-year periods for global-air temperature (average across Earth’s entire surface), air temperature over land, and sea surface temperature. Confidence intervals associated with these results are presented in the main body of the report.
Figure 2
Temperature Trends Estimated Using Linear Regression Across 30-Year Periods

Key observations from Figure 2 include:
- Estimated warming rates have increased across successive 30-year periods, consistent with an acceleration in global warming. For the most recent 30-year period, the estimated trend in global air temperature is approximately 0.48°F per decade.
- The warming rate over land exceeds that of sea surface temperature, consistent with the greater heat capacity of water (relative to air) and the vertical mixing of heat within the ocean.
- Due in part to hemispheric differences in land-ocean distribution, land areas in the Northern Hemisphere are warming at a faster rate than those in the Southern Hemisphere.
Later sections of this report show that, within the Northern Hemisphere, warming rates are strongly correlated with latitude, with the fastest warming observed in the Arctic region.
This report is accompanied by a downloadable Excel file containing the data and an interactive graph for visualizing temperature trends.
Materials
Quarterly Warming Report 2026 Q1
Quarterly Warming Report Data Analysis Workbook
Interactive Tableau map of temperature data
Suggested Citation
Wiese, Patrick. Quarterly Global Warming Report. Society of Actuaries Research Institute, January 2026. https://www.soa.org/resources/research-reports/2024/quarterly-global-warming/
Questions or Comments?
Give us your feedback! Take a short survey on this report. Take Survey
If you have comments or questions, please send an email to Research@soa.org