
Introduction
The United States and India—whose economic and institutional ties have deepened significantly since India’s liberalization in 1991[1,2,3]—offer an instructive comparative case in health care financing. The United States, with national health expenditures of $5.3 trillion in 2024 (18.0% of GDP, nearly double the OECD average of approximately 9.2%), operates a multi-payer system characterized by employer-based coverage, public insurance programs, and regulated marketplaces.[4] India, where total health expenditure was approximately 3.83% of GDP in FY 2021–22, relies on a combination of public programs, private insurance, and substantial out-of-pocket payments.[5] This article presents a comparative overview of health care financing in the two countries, examining their structural features, coverage mechanisms, cost dynamics, and emerging reforms. The analysis draws on recent data and is intended to offer actuarial professionals a descriptive framework for understanding how each system distributes and manages health-related financial risk.
Health Care Financing: A Comparative Overview
The health care financing architectures of the United States and India differ substantially in scale, structure, and the distribution of financial risk. Understanding these differences requires examining how each system is funded, who bears the cost burden, and what coverage gaps persist.
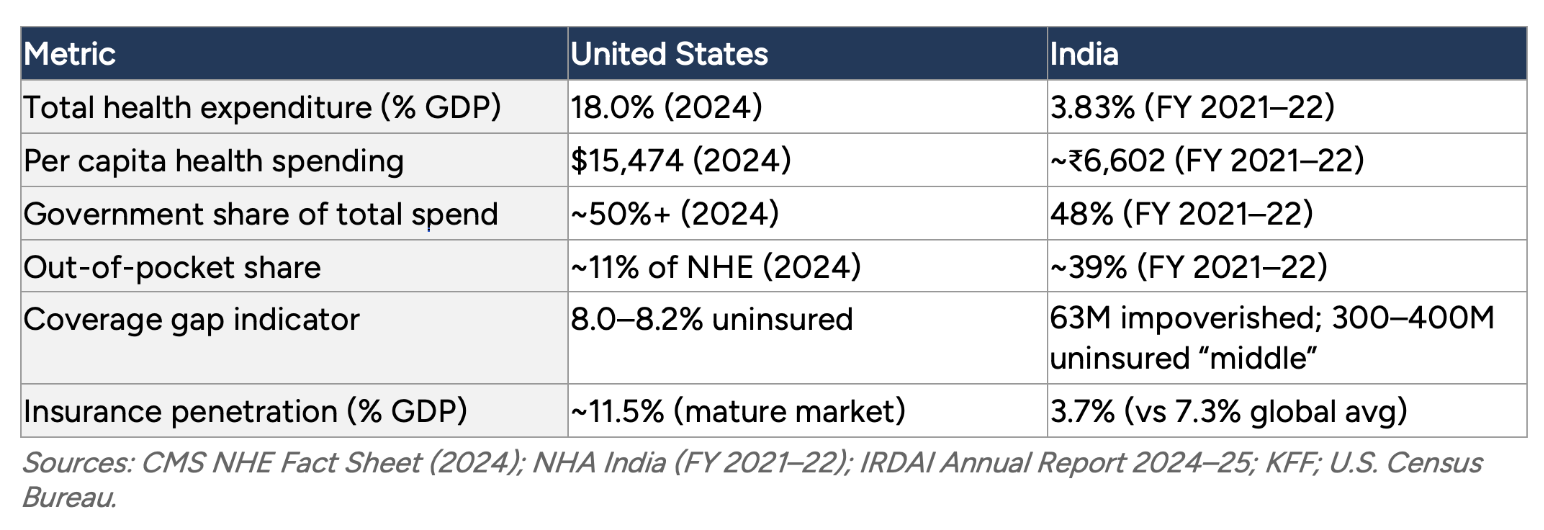
In the United States, national health expenditure reached $5.3 trillion in 2024, or $15,474 per capita.[6] The system distributes financing across several channels: employer-sponsored insurance covers approximately 164.7 million people under age 65[7]; Medicare serves about 62.8 million beneficiaries[8]; Medicaid and CHIP enroll approximately 76 million individuals[9]; and the ACA marketplace and individual market cover much of the remainder. Despite this multi-layered architecture, an estimated 8.0–8.2% of the population remained uninsured in 2024.[10]
In India, total health expenditure stood at approximately ₹9.04 trillion (Rs 9.04 lakh crore) in FY 2021–22, or roughly 3.83% of GDP.[11] Government health expenditure as a share of GDP increased from 1.13% in 2014–15 to 1.60% in 2021–22, and further to approximately 1.9% in FY24.[12,13] The government’s share of total health spending rose from 29% in 2014–15 to 48% in 2021–22.[14] Out-of-pocket expenditure, while declining from 69.4% of total health spending in 2004–05 to approximately 39% in 2021–22, remains high by international standards.[15] An estimated 63 million Indians are pushed into poverty by health costs each year[16], and health care spending for approximately 90 million individuals exceeds the catastrophic threshold of 10% of household consumption—a burden affecting an estimated 24% of Indian households.[17]
In the United States, a 2019 study estimated that approximately 530,000 families file for bankruptcy annually due to medical issues, accounting for roughly 66% of all personal bankruptcies.[18] While the mechanisms differ—bankruptcy filings in the U.S. versus impoverishment in India—both systems exhibit significant financial exposure for households facing health events.
From an actuarial perspective, these patterns reflect different modes of incomplete risk pooling. The U.S. system pools risk within discrete segments (employer groups, public programs, marketplace cohorts) but leaves gaps between them. India’s system has historically individualized much of the risk burden through out-of-pocket financing, though public programs are expanding coverage. Both approaches result in measurable financial vulnerability for specific population segments.
Table 1
Health Care Financing at a Glance
The United States: Multi-Payer Complexity and Fragmented Risk
Employer-Sponsored Insurance
Employer-sponsored insurance (ESI) has been the primary coverage mechanism in the United States for more than seven decades. Its origins are largely historical: during World War II, wartime wage controls led employers to compete for workers through health benefits, and the Internal Revenue Code of 1954 codified the tax exemption for employer-provided coverage. Today, approximately 164.7 million people under age 65 receive health insurance through an employer.[19]
Average annual premiums in 2024 were $8,951 for single coverage and $25,572 for family coverage.[20] ESI provides stable coverage for those with full-time employment but is structurally linked to job status. Part-time workers, independent contractors, and gig economy participants often lack access. During the COVID-19 pandemic, an estimated 3.3 million Americans lost employer-sponsored coverage, illustrating the sensitivity of this model to labor market disruptions. Looking ahead, employers are projecting average cost increases of 10% to 12% for 2026, driven by economic inflation, high-cost claimants, and the rising prevalence of chronic conditions.[21]
Public Programs: Medicare, Medicaid and the Affordable Care Act
Medicare, the federal program for Americans aged 65 and older and certain individuals with disabilities, covers approximately 62.8 million beneficiaries as of 2025. Medicare spending totaled $1,118 billion in 2024, representing 21% of national health expenditure.[22] Notably, 54% of Medicare beneficiaries are now enrolled in Medicare Advantage, the private-plan alternative to traditional fee-for-service Medicare.[23]
Medicaid and the Children’s Health Insurance Program (CHIP) together enrolled approximately 76 million individuals nationally as of November 2025, with total spending of $931.7 billion in 2024 (18% of NHE).[24,25] Eligibility criteria and benefit packages vary considerably by state, creating geographic differences in access and coverage.
The Affordable Care Act (ACA) of 2010 introduced regulated marketplaces, income-based premium subsidies, and Medicaid expansion in participating states. These provisions contributed to a reduction in the uninsured rate from approximately 16% in 2010 to 8.0–8.2% in 2024.[26,27] Together, these programs—ESI, Medicare, Medicaid, and the ACA marketplace—form a multi-layered architecture that pools risk within discrete segments but leaves transitions between segments as points of potential coverage discontinuity.
Cost Structure and Market Dynamics
Health care costs in the United States have grown at a rate exceeding general wage growth for more than two decades, with total spending now at 18.0% of GDP.[28] National health expenditure is projected to reach 20.3% of GDP by 2033.[29]
Hospital consolidation has been a significant factor in cost dynamics. The U.S. Department of Health and Human Services has found that horizontal mergers in concentrated hospital markets can raise prices by 6% to 65%. Vertical integration is equally pronounced: the share of physicians affiliated with hospital systems rose from 30% in 2012 to 47% in 2024, enabling the reclassification of services into higher-paying hospital settings.[30] Such consolidation reduces competitive pressure in local markets and affects insurer–provider negotiation dynamics. For insurers and employers, these trends translate into higher claim severity and increased pressure on premium adequacy.
Private equity investment in health care delivery has introduced new capital and operational approaches but has also raised questions about the alignment of financial incentives with clinical priorities.
Pharmaceutical Pricing
Prescription drug costs remain a major component of U.S. health expenditure. The Inflation Reduction Act (IRA) of 2022 granted Medicare limited authority to negotiate prices for select high-cost drugs.[31] Under this program, 10 drugs with negotiated prices take effect in 2026, and 15 additional drugs have been selected for 2027, with estimated annual out-of-pocket savings of $1.5 billion.[32]
Other federal programs already obtain significant discounts: the Veterans Health Administration and the Medicaid Drug Rebate Program secure prices well below commercial rates through statutory mechanisms. Manufacturers have also increasingly entered negotiated rebate agreements with Medicaid, particularly for high-cost cardiovascular and oncology drugs. These developments represent a gradual shift toward more active federal involvement in pharmaceutical price determination, though the scope of negotiation authority remains limited relative to the broader market.
India: Public Investment, Expanding Coverage and Structural Constraints
Fiscal Commitment and Historical Context
Since independence in 1947, India has pursued a state-led development model in which public institutions anchor the delivery of essential services. Health has been part of this mandate, though public expenditure has historically been modest. Government health expenditure as a share of GDP was 1.13% in 2014–15.[33] This figure has increased over the past decade, reaching 1.60% by 2021–22 and approximately 1.9% in FY24.[34,35] The government’s share of total health expenditure rose from 29% in 2014–15 to 48% in 2021–22.[36]
Despite these increases, India’s public health spending remains low by international comparison. Total health expenditure of approximately 3.83% of GDP compares with 18.0% in the United States.[37,38] The relatively limited fiscal allocation has meant that households bear a substantial portion of costs directly. As discussed earlier, out-of-pocket expenditure has declined significantly but remains at approximately 39% of total health spending[39], a significant reduction but still high enough to contribute to the household impoverishment patterns described earlier.[40]
In actuarial terms, the risk of health care financing in India has been largely individualized rather than pooled, with households bearing a disproportionate share of financial exposure. Recent policy initiatives aim to shift this balance.
Ayushman Bharat: Structure and Scale
Launched in 2018, Ayushman Bharat (“Healthy India”) is the Indian government’s principal initiative toward expanding health protection. It comprises two components: the Pradhan Mantri Jan Arogya Yojana (PM-JAY), which provides hospitalization insurance of up to ₹500,000 (approximately $6,000) per family per year to low-income households; and a network of Health and Wellness Centers (HWCs) offering primary and outpatient care.[41]
As of March 2025, over 369 million (36.9 crore) Ayushman cards had been created, and the program was expanded to cover senior citizens aged 70 and above.[42] Authorized hospital admissions under PM-JAY have grown steadily: from 15.9 million in 2022–23 to 19.8 million in 2023–24 to 24.2 million in 2024–25.[43] The Economic Survey 2024–25 reported recorded savings of over ₹1.25 trillion (Rs 1.25 lakh crore) through the program.[44]
The PM-JAY model blends public financing with mixed delivery: the government bears financial risk while contracting both public and private hospitals. Implementation has revealed challenges familiar to comparative health policy: while PM-JAY pools high-severity, low-frequency risks (hospitalization), outpatient and diagnostic coverage through HWCs remains uneven. This asymmetry can skew utilization toward inpatient care and leave routine costs outside the risk pool. Early evidence on financial protection is encouraging: a study in Haryana found that direct medical expenses for hospitalization were 65% lower among PM-JAY beneficiaries than non-beneficiaries, and the prevalence of catastrophic health expenditure was 13.3% among beneficiaries compared with 45.9% among non-beneficiaries.
Provider engagement has also been a factor. Many private hospitals report reimbursement rates 30–40% below market prices, and delayed payments have limited participation in some regions. These dynamics parallel challenges observed in U.S. Medicaid programs, where provider reimbursement levels influence network adequacy and beneficiary access.
Workforce and Infrastructure
Health care access in India is significantly influenced by geographic distribution of resources. India has reached approximately one physician per 1,000 population by 2024[45], compared with roughly 2.6 physicians per 1,000 in the United States.[46] Nursing ratios show a wider gap: approximately 1.7 per 1,000 in India versus nine per 1,000 in the United States.[47] Urban centers, particularly major metropolitan areas, have private facilities that meet international standards, while rural and semi-urban areas face persistent shortages.
Physician emigration compounds these disparities: an estimated 6.6 percent of India’s registered doctors practice abroad, with concentrations in the United States, the United Kingdom, and Australia.[48,49] Some states have implemented public-private partnerships, allowing private operators to manage public hospitals under performance-linked contracts. These arrangements have shown results in states such as Gujarat and Karnataka but remain variable in scale and sustainability. From an actuarial standpoint, these workforce and infrastructure disparities produce uneven risk exposure: concentrated claims in urban centers coexist with latent, unrecorded health care needs in underserved areas.
The Missing Middle
India’s health insurance landscape reflects the segmentation of its labor market. At one end, low-income households are covered under Ayushman Bharat. At the other, salaried employees in the formal sector receive employer-provided or government insurance. Between these groups lies an estimated 300 to 400 million people—the “missing middle”—who are neither eligible for public subsidies nor able to afford comprehensive private insurance.[50] This group includes small business owners, self-employed professionals, and workers in India’s large informal sector.
Efforts to address this gap include top-up and microinsurance products and standardized low-cost plans promoted by India’s insurance regulator (IRDAI). These offerings face barriers common to voluntary insurance markets: low awareness, high administrative costs relative to premium revenue, and affordability constraints. Voluntary enrollment tends to attract higher-risk individuals, creating adverse selection dynamics and upward pressure on premiums—a pattern well documented in individual insurance markets globally.[51]
These structural constraints are reflected in market-level indicators. India’s overall insurance penetration stands at 3.7% of GDP, roughly half the global average of 7.3%, with health insurance representing a growing but still underdeveloped segment. Private health insurers report an average incurred claim ratio of approximately 87%, indicating tight margins that constrain both product innovation and affordability—a supply-side barrier that compounds the demand-side challenges of adverse selection in this market.
To address these gaps, IRDAI has introduced the “Bima Trinity” initiative: Bima Vistaar, a standardized composite insurance product priced at ₹1,500 per individual covering life, health, accident, and property; Bima Sugam, a digital marketplace intended to reduce intermediary costs; and Bima Vahak, a localized distribution channel using women representatives at the village level to build trust and expand access in rural communities. Together, these represent a regulatory attempt to bring formal insurance mechanisms to populations that voluntary markets have not reached.
Digital Health Transformation
Both countries have invested in digital health infrastructure, though from different starting points and with different objectives.
In India, the Ayushman Bharat Digital Mission (ABDM), launched in 2021, is building a unified health information framework that links patient records, provider networks, and insurance claims under a single interoperable system.[52] Each citizen receives a unique 14-digit digital health ID linked to their health records; as of late 2025, over 834 million ABHA digital IDs had been created and 787 million health records linked. Meanwhile, the eSanjeevani telemedicine platform has delivered over 276 million consultations as of November 2024, extending access to remote and rural populations.[53] Digital registries have also improved transparency in PM-JAY claims processing and reduced fraud.
In the United States, the HITECH Act (2009) catalyzed the adoption of Electronic Health Records (EHRs), which has grown from less than 10% of hospitals to near-universal coverage.[54] Interoperability has remained a challenge, prompting federal initiatives such as the 21st Century Cures Act (2016) and the Trusted Exchange Framework and Common Agreement (TEFCA), launched in 2023, to standardize data sharing across systems. By early 2026, 11 Qualified Health Information Networks had been designated under TEFCA, facilitating the exchange of over 474 million documents.[55] Telemedicine adoption accelerated during the COVID-19 pandemic and has stabilized as a significant modality, with virtual visits accounting for an estimated 20–25% of outpatient encounters by 2024.
For actuarial practice, digital health data offers substantial potential in both countries: real-time experience monitoring, improved risk stratification, dynamic pricing of public and private risk pools, and earlier identification of utilization trends that inform cost projections and reserve estimates.
Converging Challenges and Emerging Models
Despite their structural differences, the United States and India face several parallel challenges in health care financing.
Value-based care models are under development in both systems. In the United States, accountable care organizations (ACOs) and bundled payment arrangements seek to align provider incentives with patient outcomes rather than service volume.[56] In India, performance-based contracts with public and private providers aim to improve quality while managing costs. In both cases, the effectiveness of these models depends on the accuracy of risk adjustment methodologies and the ability to identify and manage adverse selection.[57]
Demographic pressures present distinct but related challenges. India faces a growing burden of non-communicable diseases even as infectious disease risks persist, creating a dual epidemiological profile that complicates benefit design and cost projection. The United States confronts an aging population, with Medicare enrollment projected to reach 80 million by 2030, placing increasing fiscal pressure on public programs.[58]
Climate-related health risks are an emerging consideration for both systems.[59] Extreme weather events, changing disease vectors, and air quality deterioration may increase health care utilization in ways not fully captured by historical actuarial data. Both systems will need to incorporate environmental risk factors into their forecasting models.
In both contexts, actuarial assumptions built on historical experience data may require recalibration as epidemiological, demographic, and environmental conditions evolve. The ability to adapt pricing, reserving, and benefit design to these shifting parameters will be a defining challenge for actuarial professionals in both countries.
The convergence of technical tools—risk adjustment methodologies in Medicare Advantage and PM-JAY, real-time digital claims data, and value-based contracting frameworks—means that actuaries in both countries increasingly draw on a shared analytical toolkit. Cross-jurisdictional experience sharing could accelerate the development of climate-adjusted morbidity assumptions and more robust reserving frameworks for populations undergoing rapid epidemiological transition.
Conclusion
The United States and India represent two distinct approaches to the same fundamental challenge: distributing the financial costs of health risk across a population. The U.S. system operates at a high level of expenditure with extensive but segmented coverage, leaving gaps at the transitions between employer, public, and marketplace coverage. India’s system operates with comparatively limited fiscal resources, relying on expanding public programs and a declining but still substantial out-of-pocket burden.
Both systems are evolving. The United States is moving toward greater federal involvement in pharmaceutical pricing and experimenting with value-based payment models. India is scaling public insurance through Ayushman Bharat, building digital health infrastructure, and gradually increasing government health expenditure as a share of GDP. Each system also offers instructive strengths: the United States continues to drive biomedical innovation and high-quality specialized care delivery, while India has demonstrated that large-scale public insurance can be deployed rapidly and that digital infrastructure can leapfrog traditional institutional development.
For actuaries, the comparative study of these systems offers practical and conceptual value. The mechanisms of risk pooling, the dynamics of adverse selection in voluntary markets, the effects of provider consolidation on claim costs, and the potential of digital data for risk measurement are shared concerns across both environments. Ultimately, the actuarial task—quantifying uncertainty and designing sustainable financing structures—is common to both systems, even as the institutional and fiscal contexts differ substantially.
Ankit Nanda, FSA, MAAA, FCA, is manager, Actuarial Advisory Services at Optum Global Solutions in India. He can be reached at ankit_nanda@optum.com. The views expressed in this article are solely those of the author in his personal capacity and do not represent the views, positions, or policies of UnitedHealth Group, Optum, or any affiliated entity. The purpose of the piece is to provide a high-level, descriptive comparison of social insurance models in India and the United States. It does not advocate for any policy changes, critique any specific organizations, or take positions on regulatory matters. The tone is academic and descriptive rather than prescriptive.
This article is provided for informational and educational purposes only. Neither the Society of Actuaries nor the respective authors’ employers make any endorsement, representation or guarantee with regard to any content, and disclaim any liability in connection with the use or misuse of any information provided herein. This article should not be construed as professional or financial advice. Statements of fact and opinions expressed herein are those of the individual authors and are not necessarily those of the Society of Actuaries or the respective authors’ employers.
[1] Dennis Kux, India and the United States: Estranged Democracies, 1941–1991. (Washington, D.C.: National Defense University Press, 1992.)
[2] World Bank. “India Development Update: India’s Reform Story.” World Bank Group, 2018, https://www.worldbank.org/en/country/india.
[3] Tanvi Madan, Fateful Triangle: How China Shaped U.S.-India Relations During the Cold War. (Washington, D.C.: Brookings Institution Press, 2020.)
[4] Centers for Medicare and Medicaid Services, “National Health Expenditure Data: NHE Fact Sheet,” CMS.gov, January 2026. https://www.cms.gov/data-research/statistics-trends-and-reports/national-health-expenditure-data/nhe-fact-sheet.
[5] National Health Systems Resource Center, “National Health Accounts Estimates for India 2021–22,” nhsrcindia.org, https://nhsrcindia.org/sites/default/files/2024-09/NHA%202021-22.pdf.
[6] Centers for Medicare and Medicaid Services, “National Health Expenditure Data: NHE Fact Sheet,” CMS.gov, January 2026. https://www.cms.gov/data-research/statistics-trends-and-reports/national-health-expenditure-data/nhe-fact-sheet.
[7] Gary Claxton, Matthew Rae, Aubrey Winger, “Employer Health Benefits: Health Policy 101,” KFF.org, October 8, 2025, https://www.kff.org/health-costs/health-policy-101-employer-sponsored-health-insurance/.
[8] Nancy Ochieng, Meredith Freed, Jeannie Fuglesten Biniek, Anthony Damico, and Tricia Neuman, “Medicare Advantage Enrollment Update and Key Trends,” KFF.org, July 28, 2025, https://www.kff.org/medicare/medicare-advantage-enrollment-update-and-key-trends/.
[9] KFF, Medicaid Enrollment and Unwinding Tracker, KFF.org, March 2, 2026, https://www.kff.org/medicaid/medicaid-enrollment-and-unwinding-tracker/.
[10] Lisa N. Bunch and Halelujha Ketema, “Health Insurance Coverage in the United States: 2024,” U.S. Census Bureau, September 9, 2025, https://www.census.gov/library/publications/2025/demo/p60-288.html.
[11] National Health Systems Resource Centre, “National Health Accounts Estimates for India 2021–22,” nhsrcindia.org, https://nhsrcindia.org/sites/default/files/2024-09/NHA%202021-22.pdf.
[12] National Health Systems Resource Centre, “National Health Accounts Estimates for India 2021–22,” nhsrcindia.org, https://nhsrcindia.org/sites/default/files/2024-09/NHA%202021-22.pdf.
[13] Press Information Bureau, Government of India, Health Expenditure Update FY24. https://www.pib.gov.in/PressReleasePage.aspx?PRID=2034937.
[14] Nandita Banerji, “Economic Survey 2024-25: India’s health spending doubles in four years to Rs 6.1 lakh crore,” Down To Earth, January 31, 2025, https://www.downtoearth.org.in/health/economic-survey-2024-25-indias-health-spending-doubles-in-four-years-to-rs-61-lakh-crore.
[15] Prachi Salve, “Health Budget Grows Every Year — So Why Isn’t Public Healthcare Improving?” IndiaSpend, February 1, 2026, https://www.indiaspend.com/health/health-budget-grows-every-year-so-why-isnt-public-healthcare-improving-978653.
[16] Jordan Levinson, “63 Million Indians Pushed into Poverty Due to Health Expenses Each Year,” One Health Trust, June 4, 2016, https://onehealthtrust.org/news-media/blog/63-million-indian-pushed-into-poverty-due-to-health-expenses-each-year/.
[17] Anamika Pandey, G. Anil Kumar, Rakhi Dandona, and Lalit Dandona, “Variations in Catastrophic Health Expenditure Across the States of India: 2004 to 2014,” PLOS ONE 13, no. 10 (October 2018). https://journals.plos.org/plosone/article?id=10.1371/journal.pone.0205510.
[18] David U. Himmelstein, Robert M Lawless, Deborah Thorne, et al., “Medical Bankruptcy in the United States, 2019,” American Journal of Public Health 109 no.3 (March 2019):431–433. https://pmc.ncbi.nlm.nih.gov/articles/PMC6366487/.
[19] Gary Claxton, Matthew Rae, Aubrey Winger, “Employer Health Benefits: Health Policy 101,” KFF.org, October 8, 2025, https://www.kff.org/health-costs/health-policy-101-employer-sponsored-health-insurance/.
[20] Gary Claxton, Matthew Rae, Aubrey Winger, “Employer Health Benefits: Health Policy 101,” KFF.org, October 8, 2025, https://www.kff.org/health-costs/health-policy-101-employer-sponsored-health-insurance/.
[21] Paul Fronstin and Stephen A. Woodbury, “How Many Americans Have Lost Jobs with Employer Health Coverage During the Pandemic?” Commonwealth Fund / Upjohn Institute, October 2020, https://www.commonwealthfund.org/blog/2021/update-how-many-americans-have-lost-jobs-employer-health-coverage-during-pandemic. See also International Foundation of Employee Benefit Plans, “Employers Project 10% Rise in Health Care Costs for 2026,” August 14, 2025, https://www.ifebp.org/resources---news/news-and-regulatory-updates/press-room/press-releases/2025/08/14/employers-project-10--rise-in-health-care-costs-for-2026; Business Group on Health, “2026 Employer Health Care Strategy Survey,” August 19, 2025, https://www.businessgrouphealth.org/newsroom/news-and-press-releases/press-releases/2026-employer-health-care-strategy-survey.
[22] Centers for Medicare and Medicaid Services, “National Health Expenditure Data: NHE Fact Sheet,” CMS.gov, January 2026. https://www.cms.gov/data-research/statistics-trends-and-reports/national-health-expenditure-data/nhe-fact-sheet.
[23] Nancy Ochieng, Meredith Freed, Jeannie Fuglesten Biniek, Anthony Damico, and Tricia Neuman, “Medicare Advantage Enrollment Update and Key Trends,” KFF.org, July 28, 2025, https://www.kff.org/medicare/medicare-advantage-enrollment-update-and-key-trends/.
[24] KFF, Medicaid Enrollment and Unwinding Tracker, KFF.org, March 2, 2026, https://www.kff.org/medicaid/medicaid-enrollment-and-unwinding-tracker/.
[25] Centers for Medicare and Medicaid Services, “National Health Expenditure Data: NHE Fact Sheet,” CMS.gov, January 2026. https://www.cms.gov/data-research/statistics-trends-and-reports/national-health-expenditure-data/nhe-fact-sheet.
[26] Lisa N. Bunch and Halelujha Ketema, “Health Insurance Coverage in the United States: 2024,” U.S. Census Bureau, September 9, 2025, https://www.census.gov/library/publications/2025/demo/p60-288.html.
[27] Lisa N. Bunch and Halelujha Ketema, “Health Insurance Coverage in the United States: 2024,” U.S. Census Bureau, September 9, 2025, https://www.census.gov/library/publications/2025/demo/p60-288.html.
[28] Centers for Medicare and Medicaid Services, “National Health Expenditure Data: NHE Fact Sheet,” CMS.gov, January 2026. https://www.cms.gov/data-research/statistics-trends-and-reports/national-health-expenditure-data/nhe-fact-sheet.
[29] Centers for Medicare and Medicaid Services, “National Health Expenditure Projections 2024–2033: NHE Fact Sheet,” https://www.cms.gov/data-research/statistics-trends-and-reports/national-health-expenditure-data/nhe-fact-sheet.
[30] Andrew Patzman and Manali Neeck, “Health Care Provider Consolidation,” Bipartisan Policy Center, January 2025, https://bipartisanpolicy.org/issue-brief/health-care-provider-consolidation/.
[31] Inflation Reduction Act Drug Pricing Provisions. Congressional Budget Office, 2022. https://www.cbo.gov/publication/58455.
[32] Centers for Medicare and Medicaid Services, Medicare Drug Price Negotiation Program: Selected Drugs and Negotiated Prices, CMS.org, August 2023, https://www.cms.gov/priorities/medicare-prescription-drug-affordability/overview/medicare-drug-price-negotiation-program/selected-drugs-negotiated-prices.
[33] National Health Systems Resource Centre, “National Health Accounts Estimates for India 2021–22,” nhsrcindia.org, https://nhsrcindia.org/sites/default/files/2024-09/NHA%202021-22.pdf.
[34] National Health Systems Resource Centre, “National Health Accounts Estimates for India 2021–22,” nhsrcindia.org, https://nhsrcindia.org/sites/default/files/2024-09/NHA%202021-22.pdf.
[35] Press Information Bureau, Government of India, Health Expenditure Update FY24. https://www.pib.gov.in/PressReleasePage.aspx?PRID=2034937.
[36] Nandita Banerji, “Economic Survey 2024-25: India’s health spending doubles in four years to Rs 6.1 lakh crore,” Down To Earth, January 31, 2025, https://www.downtoearth.org.in/health/economic-survey-2024-25-indias-health-spending-doubles-in-four-years-to-rs-61-lakh-crore.
[37] National Health Systems Resource Centre, “National Health Accounts Estimates for India 2021–22,” nhsrcindia.org, https://nhsrcindia.org/sites/default/files/2024-09/NHA%202021-22.pdf.
[38] Centers for Medicare and Medicaid Services, “National Health Expenditure Data: NHE Fact Sheet,” CMS.gov, January 2026. https://www.cms.gov/data-research/statistics-trends-and-reports/national-health-expenditure-data/nhe-fact-sheet.
[39] Prachi Salve, “Health Budget Grows Every Year — So Why Isn’t Public Healthcare Improving?” IndiaSpend, February 1, 2026, https://www.indiaspend.com/health/health-budget-grows-every-year-so-why-isnt-public-healthcare-improving-978653.
[40] Jordan Levinson, “63 Million Indians Pushed into Poverty Due to Health Expenses Each Year,” One Health Trust, June 4, 2016, https://onehealthtrust.org/news-media/blog/63-million-indian-pushed-into-poverty-due-to-health-expenses-each-year/.
[41] National Health Authority, Pradhan Mantri Jan Arogya Yojana (PM-JAY). https://nha.gov.in/.
[42] Press Information Bureau, Government of India, Ayushman Bharat PM-JAY Update, March 2025. https://www.pib.gov.in/PressReleasePage.aspx?PRID=2116209.
[43] Press Information Bureau, Government of India, “Ayushman Bharat PM-JAY Update,” March 2025, https://www.pib.gov.in/PressReleasePage.aspx?PRID=2116209.
[44] Government of India, Ministry of Finance, “Economic Survey 2024–25,” https://www.indiabudget.gov.in/economicsurvey/.
[45] Raman Kumar and Ranabir Pal, “India achieves WHO recommended doctor population ratio: A call for paradigm shift in public health discourse!” Journal of Family Medicine and Primary Care 7, no. 5 (Sept/Oct 2018): 841–844 https://pmc.ncbi.nlm.nih.gov/articles/PMC6259525/.
[46] World Health Organization, Global Health Workforce Statistics database. https://www.who.int/data/gho/data/themes/topics/health-workforce.
[47] World Health Organization, Global Health Workforce Statistics database. https://www.who.int/data/gho/data/themes/topics/health-workforce.
[48] Karolina Socha-Dietrich and Jean-Christophe Dumont, “International Migration and Movement of Doctors to and Within OECD Countries – 2000 to 2018,” OECD Health Working Papers No. 126 (February 2021), https://www.oecd.org/en/publications/international-migration-and-movement-of-doctors-to-and-within-oecd-countries-2000-to-2018_7ca8643e-en.html.
[49] Fitzhugh Mullan, “The Metrics of the Physician Brain Drain,” New England Journal of Medicine 353, no. 17 (October 2005): 1810–1818. https://doi.org/10.1056/NEJMsa050004.
[50] Kumar Anurag and Sarwal Rakesh, “Health Insurance for India’s Missing Middle,” NITI Aayog, 2021, https://www.niti.gov.in/sites/default/files/2023-02/Health-Insurance-for-India%E2%80%99s-Missing-Middle_08-12-2021.pdf.
[51] American Academy of Actuaries, “Risk Assessment and Risk Adjustment,” actuary.org, https://www.actuary.org/content/risk-assessment-and-risk-adjustment. See also Kumar Anurag and Sarwal Rakesh, “Health Insurance for India’s Missing Middle,” NITI Aayog, 2021, https://www.niti.gov.in/sites/default/files/2023-02/Health-Insurance-for-India%E2%80%99s-Missing-Middle_08-12-2021.pdf.
[52] National Health Authority, “Ayushman Bharat Digital Mission (ABDM),” abdm.gov.in, https://abdm.gov.in/.
[53] Sanjay Sood, Kanhaiya Lal, Madhu Bhatia, et. al., “Adoption and utilization of India’s eSanjeevani national telemedicine service,” Oxford Open Digital Health 7, no. 3, (October 2025).https://pmc.ncbi.nlm.nih.gov/articles/PMC12558045/.
[54] Office of the National Coordinator for Health Information Technology, “Non-federal Acute Care Hospital Electronic Health Record Adoption,” Health IT Quick-Stat #47, September 2017, https://dashboard.healthit.gov/quickstats/pages/FIG-Hospital-EHR-Adoption.php.
[55] The Sequoia Project, “Trusted Exchange Framework and Common Agreement (TEFCA),” sequoiaproject.org, https://www.sequoiaproject.org/tefca/.
[56] Centers for Medicare and Medicaid Services, “Medicare Shared Savings Program (SSP),” CMS.gov, https://www.cms.gov/medicare/payment/fee-for-service-providers/shared-savings-program-ssp-acos.
[57] American Academy of Actuaries, “Risk Assessment and Risk Adjustment,” actuary.org, https://www.actuary.org/content/risk-assessment-and-risk-adjustment.
[58] Boards of Trustees of the Federal Hospital Insurance and Federal Supplementary Medical Insurance Trust Funds, “2025 Annual Report,” CMS.gov, June 18, 2025, https://www.cms.gov/oact/tr/2025.
[59] World Health Organization, “Climate Change and Health,” Fact Sheet, October 2023, https://www.who.int/news-room/fact-sheets/detail/climate-change-and-health.