
Nearly 40 years after a current-assumption net premium methodology entered GAAP for long-duration insurance,[1] the effects of retrospective adjustments remain mysterious to many. With this article, I make one more attempt to remove the mystery by offering an explanatory framework.
With the adoption of Accounting Standards Update No. 2018-12, “Targeted Improvements to the Accounting for Long-Duration Contracts,” investment income and expenses were mostly separated from insurance revenue and costs. (An exception is the continued inclusion of some investment margin in universal life assessments.) In this framework, it is now possible to explain underwriting profit—the focus of this article—apart from investment and expense performance.
Underwriting profit is defined here to be the excess of insurance revenue over insurance costs, where insurance costs include benefit payments, some related expenses, and accrual of liabilities for insurance benefits. Interest accretion on the liabilities, though presented as part of benefit cost in a GAAP income statement, is not included in underwriting profit. Rather, it is included in investment margin. This has the dual advantages of aligning interest cost with interest income and of separating insurance performance from unwinding of the time value of money.
Expected profit, sometimes called the earnings run rate, is a concept already familiar to financial statement users. The recurring challenge is to understand how events shape the difference between actual earnings and the run rate. In this context, an event is anything (new issues, experience variances, assumption changes, etc.) that alters the present values of expected revenue and costs.
Key Concepts
To be understood, it’s helpful when explanations are expressed with a minimum number of meaningful concepts. Toward this end, I have identified four key concepts: Fundamental gain, profit margin, margin gain, and shares of lifetime revenue. (The “time value of money” enters into the measurement of these concepts, and it is likely that financial statement users already understand this concept even if they don’t know how to measure it.)
Fundamental Gain is the contribution of an event to expected lifetime underwriting profit.
This is the first step in explaining a difference between actual and expected underwriting profit. Mathematically, it is the change in the present value of future revenue (R) minus the change in present value of future costs (C).
![]()
Profit Margin is the percent of lifetime revenue that is not needed to fund lifetime costs.
With the percent needed to fund lifetime costs captured in traditional net premium and universal benefit ratios (b),

Margin Gain is the portion of fundamental gain that is presumed (before remeasurement) to represent profit.
This may be the most difficult concept to explain, but it is essential to the matching of fundamental gain to past, current and future revenue. It is the product of a change in present value of revenue and the profit margin. Precise measurement uses the profit margin prior to the current update, as indicated by the P subscript.
![]()
Shares of Lifetime Revenue are the ratios of revenue during a reference period to lifetime revenue.
Precise measurement uses updated revenue, as indicated by the U superscript and subscript.

Building an Explanation
Once the key concepts are understood, building an explanation begins with identification of the events driving a material deviation from expected income. Next, measure the key concepts for each material event. Events contribute two elements to current deviations from expected income: Remeasurement gain (an immediate, one-time effect) and run rate change (a recurring effect).
Remeasurement gain is the portion of fundamental gain matched to past revenue as of the beginning of the reporting period.
GAAP does not match any part of margin gain to past revenue. What’s left of fundamental gain, after subtracting margin gain, is multiplied by the past share of lifetime revenue to determine the remeasurement gain.

As noted above, precise measurement uses the prior profit margin and the updated past share of lifetime revenue. Practically, using the prior ratios may suffice for explanations and has the benefit of relying only on ratios that were already known.
The remainder of fundamental gain flows through subsequent income, beginning with the current reporting period. Run rate change (∆E) is the effect on underwriting profit during the period after recognition of the remeasurement gain.
This can be precisely measured for the current reporting period and can serve as an estimate of the recurring near-term effect of an event. It has two parts, corresponding to the remeasurement and margin gains, represented in the respective terms of a simple formula.
![]()
Both terms can be explained using the four key concepts.
The first term, corresponding to the remeasurement gain, is equal to the current share of the difference between fundamental and margin gains.

The second term already resembles margin gain, but with the difference between actual and expected revenue in place of the change in present value of revenue. Except in extreme liquidity stress scenarios, this term will generally be immaterial.
Since remeasurement gain changes the liability as of the beginning of the reporting period, it also affects interest accretion on the liability, an element of investment margin. It is unlikely, however, to have a material effect on the difference between expected and actual income. Consider, for example, an average interest accretion rate of 4%. In a quarterly reporting period, interest accretion on a remeasurement gain is just 1% of the gain.
Illustration
The following illustration begins with a 20-year term life insurance cohort. At issue, the present value of future revenue is $480,000. The present value of future benefits is $360,000, for a 75% net premium ratio and a 25% profit margin. Inherent in the GAAP net premium methodology, the initial margin gain (25% × $480,000 = $120,000) is equal to the fundamental gain ($480,000 – $360,000 = $120,000). There is no remeasurement gain. And, though the margin gain will amortize into underwriting profit, it will mostly replace the runoff of existing business, such that there is no significant change in aggregate run rate.
Five years later, expected income for the quarter is $+2,801. With excess benefits of $4,411 and annualized lapses two percentage points higher than expected, actual income is $+1,011 ($1,790 less than expected).
Detailed Analysis
The combined mortality and lapse events decreased the present value of revenue (∆PV(R)=$–1,719) and increased the present value of benefits (∆PV(C)=$+2,264) for a fundamental gain of $–3,983. Since the period includes both mortality and lapse events, an explanation needs to separate the gains for each event.
The fundamental gain from mortality is estimated to be the negative of the excess benefits ($–4,411). What’s left of the fundamental gain ($+428) is attributed to lapse.
Having limited the fundamental gain from mortality to just the excess benefits, there is no margin gain from mortality. With a past share of lifetime revenue at 48.6%, the remeasurement gain from mortality (fundamental gain minus margin gain, times the past share of lifetime revenue) is ($–4,411 – $0) × 48.6% = $–2,142.
With the entire change in present value of future revenue attributed to excess lapses, the corresponding margin gain (change in present value of revenue times profit margin) is $–1,719 × 25% = $–430).
We see here a seemingly strange occurrence—fundamental gain from lapse is positive, but margin gain is negative. Odd as this might seem, it is typical of lapse events. Still, it may require extra care to explain such results. (See the sidebar, Lapse Dynamics.)
Multiplying the difference between fundamental and margin gains by the past share of lifetime revenue, the remeasurement gain from lapse is ($+428 – $–430) × 48.6% = $+417.
Together, the remeasurement gains from mortality and lapse explain $–1,726 of the $–1,790 deviation from expected underwriting profit. The remaining difference comes through a change in run rate.
This quarter’s current share of lifetime revenue is 1.8%. Multiplied by the $–3,553 difference between total fundamental gain and margin gain, this contributes $–64 of run rate change. This, a small part of the income variance, will rarely be meaningful to split between mortality and lapse effects.
Summary Explanation
In this illustration, underwriting profit is about $1,800 less than expected because:
- Claims were about $4,400 higher than expected. Almost half is matched to the past share of lifetime revenue and recognized immediately in a remeasurement gain of about $–2,100.
- Lapses were higher than expected, producing a fundamental gain of about $+400 and a margin gain of about $–400. Half of the difference is recognized immediately in a remeasurement gain of about $+400.
- Together, these events reduced the run rate by about $100. (In this specific scenario, this amount is likely too small to concern financial statement users and might be left out of the explanation.)
Supplemental Analysis
In practice, mortality and lapse effects might be separated through sequential valuation runs. For comparison, I ran them sequentially as updated lapse and mortality rates and split the run rate change. This includes the secondary effects of a mortality variance (persistency) in the mortality gain. Table 1 shows that this doesn’t change the summary explanation.
Table 1
Analysis of the Current Deviation from Expected Profit
|
Simultaneous |
Lapse First |
Mortality First |
|
|---|---|---|---|
|
Mortality Gain |
(2,142) |
(2,097) |
(2,092) |
|
Lapse Gain |
417 |
372 |
366 |
|
Mortality Run Rate |
(80) |
(78) |
(78) |
|
Lapse Run Rate |
16 |
14 |
14 |
|
Total |
(1,790) |
(1,790) |
(1,790) |
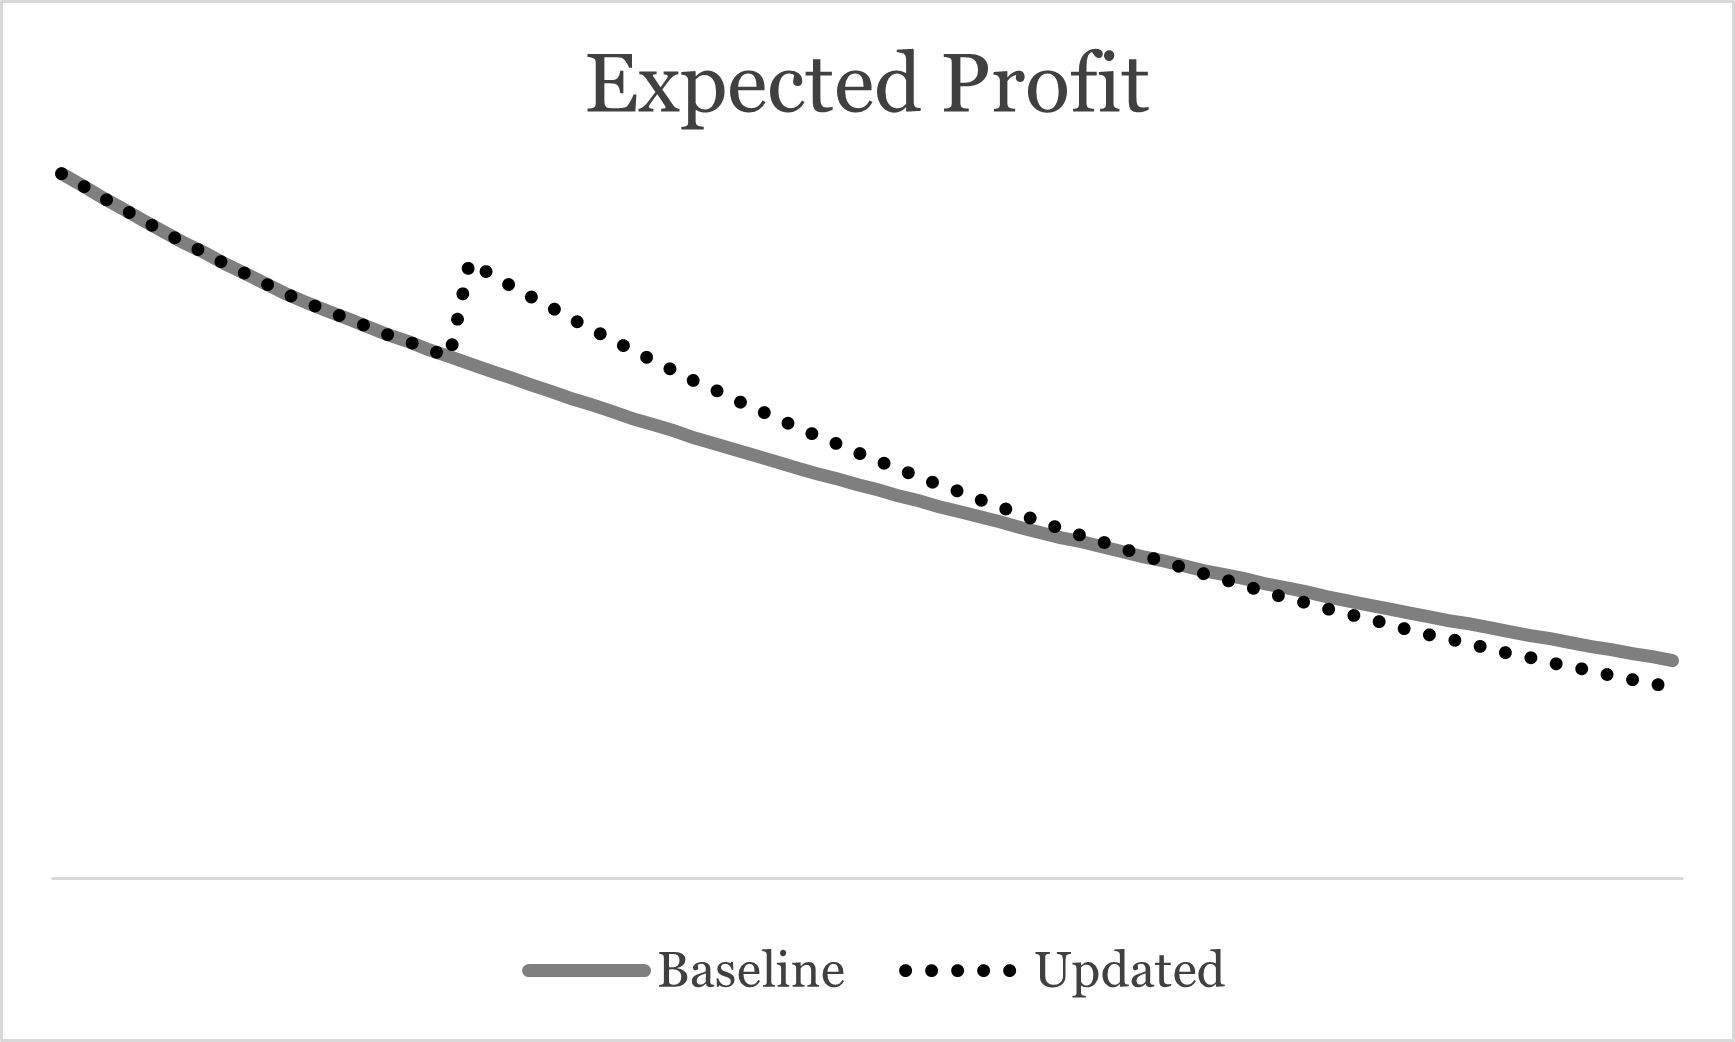
Given the complex effects of a lapse variance, I also tested the effects of a lapse assumption change on expected quarterly profit (excluding remeasurement gain) over the full 20-year term of this cohort. Like the lapse variance, increased lapse rates have a favorable effect on run rate, as shown in this chart. This also highlights how the effect is fairly stable in the near-term and how cumulative effects eventually affect revenue more than enough to offset the updated profit margin. (See Figure 1)
Figure 1
Expected Profit Before and After a Lapse Assumption Change
Aggregate Performance
In practice, aggregate performance is what matters most. Typically, there will be multiple events affecting multiple cohorts and cohort-level analysis is needed to identify and explain material events. Often, detailed explanations can be summarized as just a few major events.
In addition, several other factors (reinsurance, limited-payment contracts, constraints, universal life without an additional net premium reserve) may affect explanations. Each of these can alter the amount of fundamental gain or its allocation among past, present and future accruals.
All of these calculations can be programmed for quick calculation of cohort-level detail, either inside a valuation system or outside using an extract of valuation system results. Even simple database tools can then be used to group results in various ways to quickly narrow the overall story into a small number of material events.
This article is provided for informational and educational purposes only. Neither the Society of Actuaries nor the respective authors’ employers make any endorsement, representation or guarantee with regard to any content, and disclaim any liability in connection with the use or misuse of any information provided herein. This article should not be construed as professional or financial advice. Statements of fact and opinions expressed herein are those of the individual authors and are not necessarily those of the Society of Actuaries or the respective authors’ employers.
Steve Malerich, FSA, MAAA, is a retired actuary. He can be reached at sfmalerich@gmail.com.
Endnote
[1] Accounting for universal life acquisition costs under Statement of Financial Accounting Standards No. 97, “Accounting and Reporting by Insurance Entities for Certain Long-Duration Contracts and for Realized Gains and Losses from the Sale of Investments,” December 1987.