
Payers evaluating new pharmacy therapies are commonly faced with two key questions: what formulary position and utilization management (UM) criteria are clinically appropriate, and what is the incremental near-term budget impact of those decisions. Actuarial budget impact models (BIMs) compare a “current world” treatment mix to one or more “future world” mixes over a decision-relevant horizon under alternative formulary and adoption scenarios.
Asthma is a chronic inflammatory respiratory condition characterized by hallmark symptoms of intermittent dyspnea, cough and wheezing. Despite significant advancements in understanding the underlying genetic loci, environmental triggers and risk factors, clinical strategies to mitigate the risks of persistent asthma development in both adolescence and adulthood remain lacking. The condition is estimated to affect about 260 million individuals worldwide and 25 million in the US.[1]
Asthma continues to be a significant burden for millions of individuals across the globe, which in turn has an impact on health care systems and society at large. It is associated with increased risk of respiratory complications and issues, reduced quality of life and, in severe cases, hospitalization and death.
Numerous therapies are available today, most in inhalation form, as this is the most effective way to deliver asthma medication directly to the lungs.[2] Other forms, such as oral, injectable or infusion, exist and allow for systemic treatment to reduce inflammation and/or target specific cells and proteins.
Among inhalers, three main medication classes are used for quick relief (“rescue”) and/or long-term control:
- Inhaled corticosteroids (ICS) reduce airway inflammation and swelling.
- Beta-2 agonist bronchodilators activate beta-2 receptors on airway smooth muscle to relax the muscle and open the airways. They’re grouped as short-acting (SABA), long-acting (LABA) and ultra-long-acting (uLABA). SABAs and LABAs are both used in asthma (for different roles).
- Muscarinic antagonists/anticholinergics block acetylcholine at muscarinic receptors, which helps relax airway muscles and can reduce secretions like mucus. These include short-acting (SAMA) and long-acting (LAMA) agents.
For people with milder asthma, an as-needed reliever (often a SABA) and/or an ICS-based approach may be sufficient.
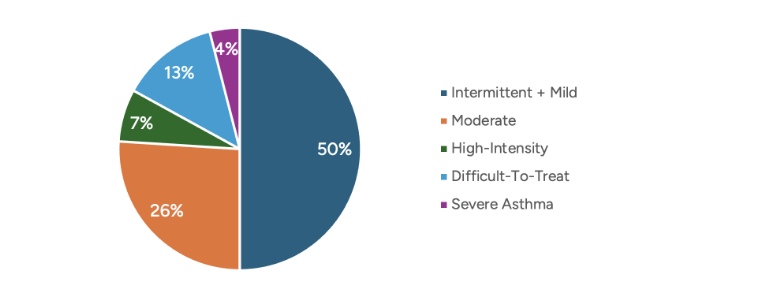
When symptoms are more frequent or more challenging to control (for example, asthma symptoms on multiple days per week, night-time waking at least weekly or poor control despite ICS and/or bronchodilators), clinicians may escalate to combination inhalers. The Global Initiative for Asthma (GINA) global strategy report shows that 24% of asthmatics suffer from high-intensity, difficult-to-treat or severe asthma, as shown in Figure 1.[3]
Figure 1
Portion of Asthmatic Individuals
Combination inhalers are simply those that combine ICS, a beta-2 agonist (SABA or LABA), and/or muscarinic antagonists (SAMA or LAMA) in some form. Multiple options combining two of the ingredients exist, but currently only two are available in the US that combine all three—ICS, LABA and LAMA—known as “triple therapy.” The triple-therapy inhalers are fluticasone furoate/umeclidinium/vilanterol (FF/UMEC/VI) and budesonide/glycopyrrolate/formoterol fumarate (BUD/GP/FF); the former is approved for the treatment of both asthma and chronic obstructive pulmonary disease (COPD), whereas the latter is approved only for COPD. If approved, beclomethosone dipropionate/formoterol fumarate/glycopyronium (BDP/FF/GPP) (currently available under the brand name Trimbow ex-US) for the treatment of asthma in 2026 will provide physicians and health insurers with additional options to support their patients. In addition to the inhaled therapies, several oral and injectable biologics have also been available to treat asthma.
Costs (Wholeshare Acquisition Cost, i.e. list price) vary significantly by therapy type, as shown in Figure 2.[4]
Figure 2
Cost per Prescription by Therapy Type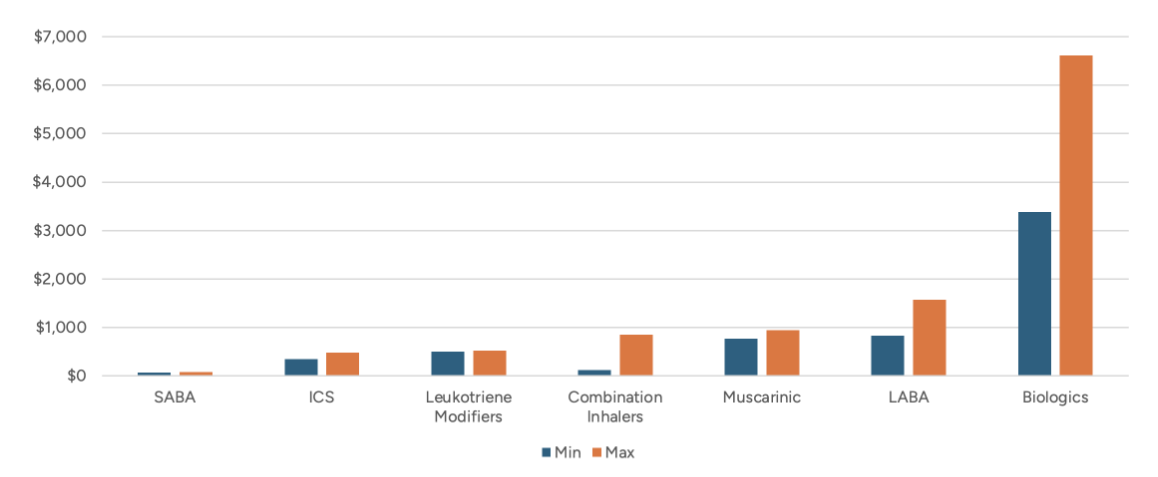
Note: Combination inhalers could be any permutation of ICS, LABA, SABA, LAMA and/or SAMA.
While the financial aspect is essential when making formulary decisions, clinicians ensure the efficacy and reduction in relative risk are taken into consideration. In a systematic review and meta-analysis of 20 randomized clinical trials (11,894 patients) with moderate-to-severe asthma, triple therapy (ICS/LABA/LAMA) was associated with a significantly lower risk of severe asthma exacerbations than dual therapy (ICS/LABA) (RR 0.83, 95% CI 0.77–0.90).[5]
As of March 2026, the FDA had yet to approve BDP/FF/GP to treat asthma. If it does, payers will have an additional triple-therapy inhaler to consider for their formulary, distinct from existing options in ICS-LABA-LAMA composition, delivery method and potentially expected net cost. As with any new market entrant, utilization is likely to shift based on formulary tier placement and utilization management program criteria.
Randomized controlled trials have shown that BDP/FF/GP is associated with either statistically significant benefit or a trend for improvement in terms of reducing the rate of severe, and moderate to severe exacerbations compared to relevant comparators.[6] Research with payer experts suggests that approximately 15% of the current triple-therapy utilization could shift over to BDP/FF/GP driven by its clinical profile, even with no change to the formulary placement of the other triple therapies. Placing BDP/FF/GP with formulary parity could maximize the impact while minimizing disruption for patients who are stable on their current treatment.
Payer Decision-Making
Payer coverage decisions for new pharmaceutical therapies are typically operationalized through formulary tier placement, utilization management requirements (e.g., step therapy and prior authorization), and contracting terms that determine net cost (e.g., rebates and value-based contracts).
Tier placement affects member cost sharing, which in turn can influence members’ therapy choices. A preferred brand position generally lowers patient out-of-pocket costs and can reduce administrative burden, whereas a non-preferred brand position is likely to increase out-of-pocket costs. This can help incentivize patients to choose preferred therapies.
Utilization management adds a second layer of access control by requiring clinical criteria or a trial of alternatives before coverage is approved.
These levers influence real-world uptake by shaping treatment choice among new starts through prescriber and patient behavior at initiation, and by affecting switching patterns among patients already receiving maintenance therapy through the creation of incentives (or barriers) to transition from an incumbent product to a newly covered alternative.
For inhaled asthma maintenance therapies specifically, switching can be clinically difficult because patients and prescribers who are stable on a current regimen may be reluctant to change devices or dosing routines absent a clinical deficit that a new therapy could resolve.
Net budget impact is therefore not only a function of list price but also of how formulary placement changes uptake, displacement across products and contracting terms translate gross drug cost into payer net cost. Contracting dynamics can also be responsive: incumbent products may adjust rebate strategies to defend market share, and such responses can alter the relative net-cost ranking that a payer experiences.
The scenarios in this actuarial BIM are designed to reflect these practical payer mechanics by pairing formulary placement assumptions (preferred versus non-preferred) with corresponding adoption trajectories and net-cost assumptions.
Modeling
This actuarial budget impact model is an Excel-based actuarial model that estimates the incremental payer budget impact associated with the introduction of BDP/FF/GP under alternative formulary placement and adoption scenarios. The key result is incremental per-member-per-month (PMPM) plan liability relative to a baseline (“current world”) scenario.
The model was parameterized to a hypothetical plan population of 1 million asthma-diagnosed individuals and projected outcomes from 2024 through 2028. The hypothetical plan population matched the total US distribution by line of business (commercial self-insured, commercial fully insured, Medicare and Medicaid) and asthma severity (intermittent/mild, moderate, high-intensity, difficult-to-treat and severe).
The model includes BDP/FF/GP and all other relevant asthma treatments, including comparator triple-therapy products. Even if BUD/GP/FF is currently not approved for asthma, IQVIA data shows that asthma claims approval rates are as high as approximately 70%, which warrants inclusion of BUD/GP/FF in the analysis since it appears that the triple therapies are managed as a class.[7] In the baseline scenario, market shares reflect the assumed “status quo” availability and utilization in the absence of BDP/FF/GP.
Adoption scenarios specify how BDP/FF/GP gains share over time and which therapies are displaced. Displacement is implemented through scenario-specific shifts in market share, reflecting the practical effects of formulary placement and associated access friction. Specifically, four adoption scenarios were constructed:
- Base Scenario: market share baseline assuming current triple-therapy product availability (i.e., in the absence of BDP/FF/GP)
- BDP/FF/GP Soft Launch: assumption that all three triple-therapy products are placed on equal preferred brand formulary status
- BUD/GP/FF Non-Preferred: assumption that BUD/GP/FF is placed on a non-preferred formulary tier
- FF/UMEC/VI Non-Preferred: assumption that FF/UMEC/VI is placed on a non-preferred formulary tier
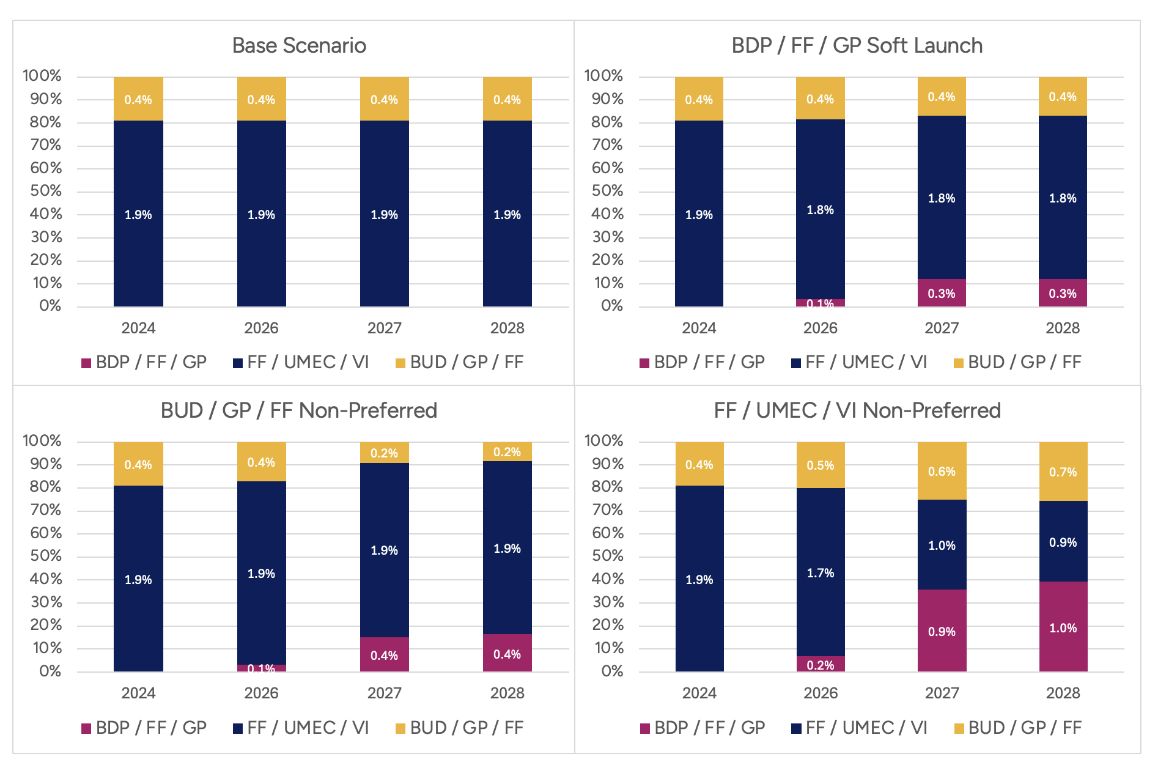
Scenarios differ by formulary placement assumptions intended to mimic real-world access conditions. In the “Soft Launch” scenario, all three triple-therapy products are assumed to have equal preferred brand status, reflecting minimal formulary steering. In the “BUD/GP/FF Non-Preferred” and “FF/UMEC/VI Non-Preferred” scenarios, the named comparator is placed on a non-preferred tier, reflecting increased member cost-sharing and reduced rebates payable to the plan. These formulary assumptions are translated into market share trajectories shown in Figure 3.
Figure 3
Market Share Trajectories in Four Adoption Scenarios
Pharmacy costs are calculated by multiplying product-specific utilization by unit-cost inputs and applying rebate/discount assumptions to estimate the payer’s net price. The scenarios incorporate alternative rebate assumptions to reflect assumed competitive responses that change net costs.
All lines of business-specific features, such as Part D benefit design, low-income subsidy cost-sharing, IRA-related changes and 340B considerations, were included in the calculation of the payer net cost.
Inputs were derived from internal model assumptions, published sources and scenario-specific contracting and adoption parameters intended to reflect payer decision levers. Some parameters were structural (e.g., population size, modeled time horizon, baseline treatment mix) and were held constant across scenarios. In contrast, others were explicit scenario levers (e.g., formulary placement, adoption trajectories and rebate/discount assumptions). Net pricing inputs were inherently plan- and contract-specific, which are subject to change.
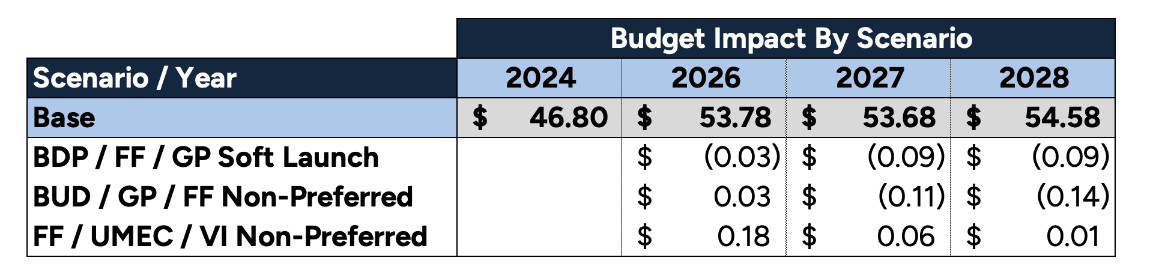
The annual incremental budget impact for the triple-therapy class, by scenario, is presented in Table 1, along with the total PMPM in the base scenario.
Table 1
Annual Incremental Budget Impact by Scenario
Analysis
A positive incremental budget impact indicates a higher modeled payer cost relative to the baseline in that year; a negative value suggests modeled savings. Throughout, it’s important to keep in mind that model results are conditional on the scenario definitions and assumptions embedded in the adoption curves (see Figure 3) and net cost inputs.
The “Soft Launch” scenario is intended to reflect minimal formulary steering, in which products are treated similarly with respect to access. Under this framing, changes in budget impact primarily reflect the modeled net cost of BDP/FF/GP relative to the baseline mix and the uptake path that occurs when access barriers are comparable across options.
The “BUD/GP/FF Non-Preferred” and “FF/UMEC/VI Non-Preferred” scenarios represent active formulary steering by disadvantaging one incumbent through non-preferred placement. Under these scenarios, budget impact is driven by the degree to which non-preferred placement shifts market share away from the disadvantaged product and toward alternatives (including BDP/FF/GP), consistent with the adoption curves shown in Figure 3.
The model is most useful when viewed as a set of bounded alternatives: base case (status quo), parity access (“Soft Launch”), and targeted steering (“Non-Preferred” scenarios). The appropriate payer inference is not a single point estimate but rather the range of incremental outcomes that plausibly follow from different placement choices and contracting environments.
In the “Soft Launch” scenario, modeled net costs decrease because BDP/FF/GP is assumed to have a lower net cost per prescription than the baseline weighted average of the triple-therapy mix. At the same time, equal formulary parity avoids abrupt rebate decreases within the class. The scenario is designed to isolate the effect of adding a lower-net-cost option under conditions in which the formulary does not firmly steer utilization across products.
The model further assumes that patients who are stable on successful therapies do not switch solely because a lower-net-cost option becomes available. In contrast, new-to-therapy patients are more sensitive to a combination of clinical considerations and the financial/access conditions created by formulary placement. This structure leads to modest BDP/FF/GP adoption across scenarios, even when competing class therapies are placed in a non-preferred status, because non-preferred placement primarily influences new starts and a limited subset of switchers rather than triggering wholesale conversion of the existing treated population.
In the “BUD/GP/FF Non-Preferred” and “FF/UMEC/VI Non-Preferred” scenarios, positive incremental budget impact observed in some earlier modeled years reflects a timing mismatch between the loss of net price concessions associated with the disadvantaged product, which have larger baseline market shares dramatically reducing rebates, and the scale of savings generated by BDP/FF/GP, which begins from a smaller share and ramps up over time. As BDP/FF/GP’s market share increases in subsequent years, the modeled savings associated with its lower net cost per prescription become a larger share of total class spending, and the net cost advantage begins to dominate the overall budget impact.
Conclusion
The addition of BDP/FF/GP to the US drug market is likely to benefit patients, health insurers, providers and society at large based on the analysis modeled in this article. From a purely economic perspective, competition reduces prices. From a clinical perspective, an additional option that differs in composition and delivery, and is supported by higher proven efficacy, provides clinicians with new means to help their patients.
This actuarial BIM shows that if health plans add BDP/FF/GP to their formulary, it may reduce their net plan cost, improve outcomes and lower total cost of care, benefiting many stakeholders. Many questions remain regarding pricing and rebates, launch timing, adoption rates and other issues, but these are expected to be answered in 2026. The actuarial BIM can be used to explore various scenarios related to these questions.
The results of this analysis may not apply to every individual or health plan; however, similar results are likely across a large, actuarially credible population.
This article is provided for informational and educational purposes only. Neither the Society of Actuaries nor the respective authors’ employers make any endorsement, representation or guarantee with regard to any content, and disclaim any liability in connection with the use or misuse of any information provided herein. This article should not be construed as professional or financial advice. Statements of fact and opinions expressed herein are those of the individual authors and are not necessarily those of the Society of Actuaries or the respective authors’ employers.
Nate Stokes, ASA, MAAA, is a consulting actuary at Axene Health Partners. Nate can be reach at nathan.stokes@axenehp.com.
Endnotes
- Jennifer Goldin and Mary E. Cataletto, “Asthma,” StatPearls (StatPearls Publishing, 2024), https://www.ncbi.nlm.nih.gov/books/NBK430901/.
- Shao-Cheng Wang, Tsu-Hsiang Kuo, Chung-I Rai and Yuan-Chuan Chen, “Inhalation: A Smart Strategy and Increasing Potential for Drug Delivery,” Drug Des Devel Ther 20 (2026): 575392. doi: 10.2147/DDDT.S575392. PMID: 41710582; PMCID: PMC12912003.
- Maria Elisa Di Cicco, et al, “Intermittent and Mild Persistent Asthma: How Therapy Has Changed,” Acta Biomed 92, supplement 7 (2021): e2021523, https://pubmed.ncbi.nlm.nih.gov/34842585/.
- Analysis of Merative™ MarketScan® Commercial and Medicare Supplemental databases and CMS Medicare 5% Limited Data Set (LDS); results generated via proprietary Budget Impact Model developed by Axene Health Partners, 2025.
- Lisa H. Y. Kim, et al, “Triple vs Dual Inhaler Therapy and Asthma Outcomes in Moderate to Severe Asthma: A Systematic Review and Meta-analysis,” JAMA, 325, no. 24 (2021): 2466–2479, https://doi.org/10.1001/jama.2021.7872.
- Fulvio Braido, et al. “Single Inhaler with Beclometasone, Formoterol, and Glycopyrronium Versus Triple Therapies in Adults with Uncontrolled Asthma: A Systematic Review and Meta-analysis,” Sci Rep 15 (2025): 4191, https://doi.org/10.1038/s41598-025-88374-w.
- IQVIA data analysis provided to Axene Health Partners.